“A Taco Truck On Every Corner” Is Coming True

When Marco Gutierrez, co-founder of Latinos for Trump, declared that “If you don’t do something about it, you’re going to have taco trucks on every corner,” it read to some like a threat, to others a hopeful possibility.
Ten years–almost to the day!–since Gutierrez uttered what he considered a terrifying version of the future, there has been a remarkable change in the US culinary landscape. While there’s not (yet) a taco shop at every intersection, Mexican cuisine is more popular than ever. The country’s restaurant tastes are diversifying, led by large urban areas and coinciding with an influx of immigrant populations from all over the world.
I used Foursquare’s open dataset of places across the United States to figure this out. Foursquare started in 2009 as a check-in app where people could register local points of interest: restaurants, bars, museums, vintage stores, polling places–anything. The app itself sunset in 2024, and Foursquare has rebranded as a “Location Intelligence Platform” incorporating (what else) AI. Fortunately, they made a lot of their data public. That includes some 109 million places spanning the globe, but concentrated in the United States: about a fifth of them are American, among them nearly 1.8 million US restaurants, with detailed information about what kinds of food they serve.
An important caveat here is that this is based on Foursquare’s data, which is primarily crowdsourced. Because of that, it’s likely also incomplete. Not every restaurant had a Foursquare-using customer step through the door, and not every Foursquare-using customer was equally diligent about describing the food. For the most part, little inaccuracies and omissions wash out when averaged over 10 years and thousands upon thousands of restaurants. But there is a second, more subtle catch: because Foursquare’s coverage of the country improved over the decade, every figure below is a proportion rather than a count. So while we can say that taco joints are a fast-growing slice of the American restaurant scene, we can’t say that precisely 10,242 of them opened.
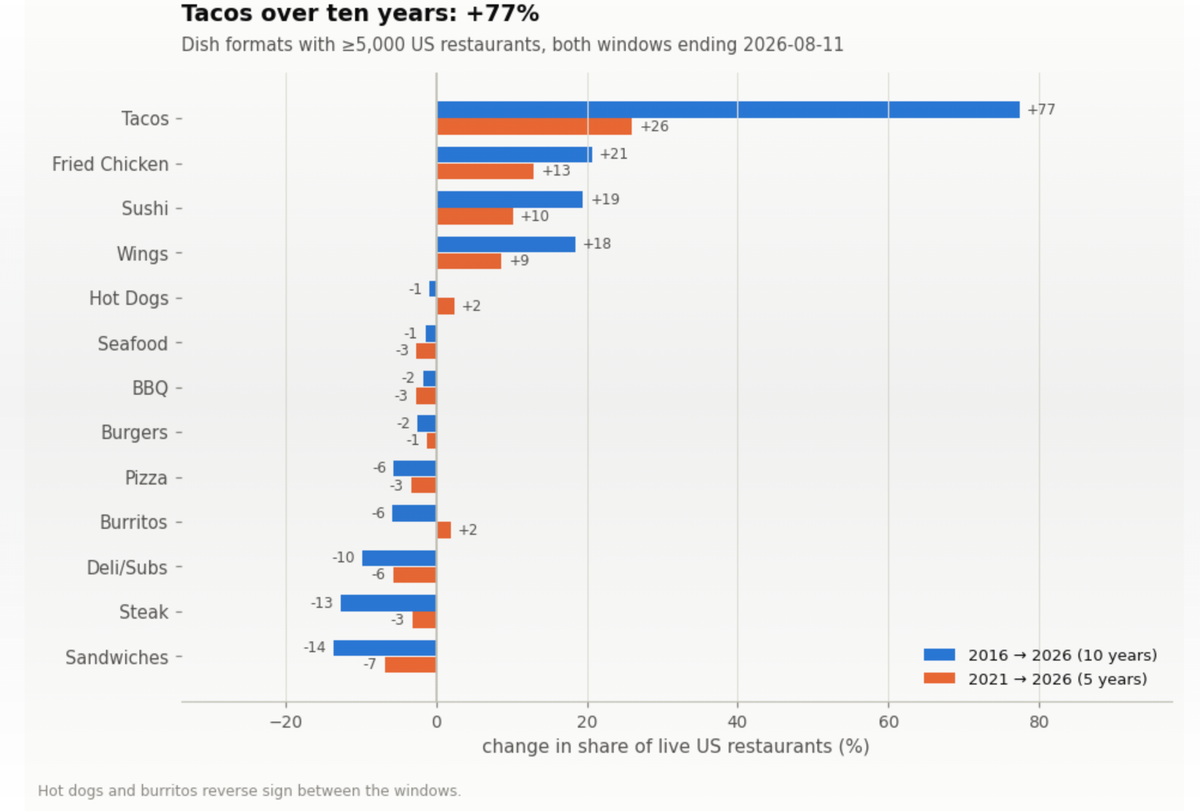
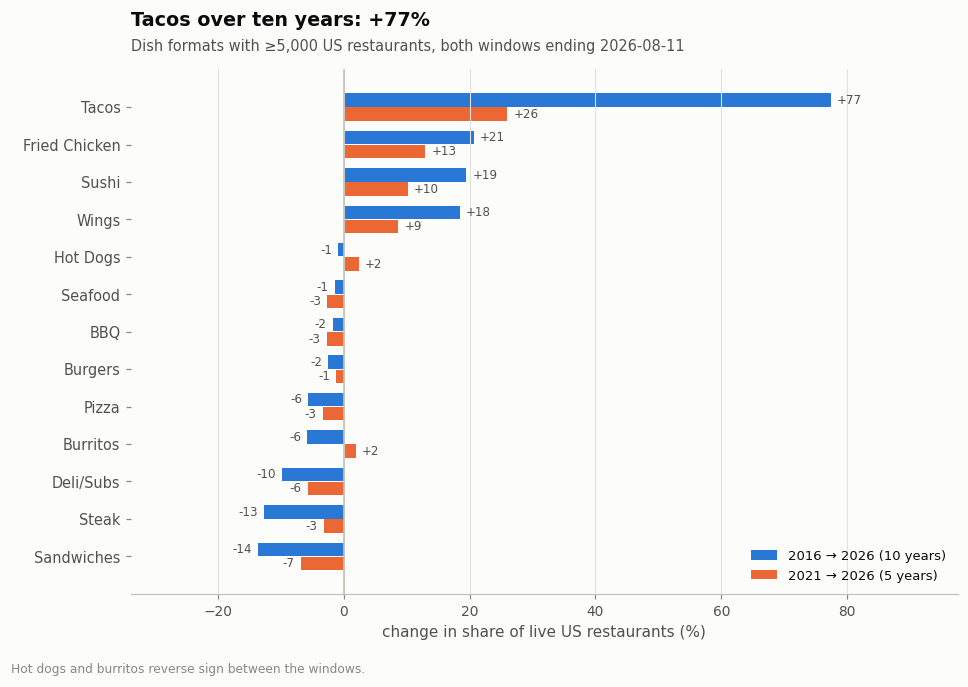
Mmmm, tacos. Americans love tacos (who doesn’t). Just as Gutierrez prophesied, taquerias are the big winner among America’s major restaurant formats over the last decade — and over the last five years too — up a remarkable 77 percent. Other trends, like second-place fried chicken (+21 percent) and sushi (+19 percent), pale in comparison. Food trucks are in as well (up 19 percent), and taco trucks in particular: up 33 percent over the decade, to the point that roughly one food truck in every nine now sells tacos.
Tacos are just one small part of the American affection for Mexican food. In fact, Mexican restaurants have nearly reached parity with American restaurants in the United States. In counties around large metropolitan areas (with a million or more people), Mexican joints are even more common than American restaurants.
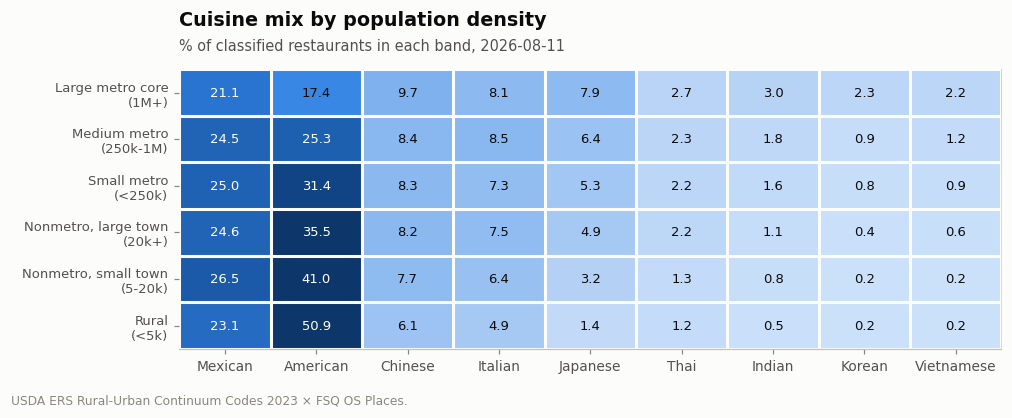
The pillars of the culinary mix are the same everywhere, but their proportions are not. The most consistent of them is Mexican food. It holds between 21 and 27 percent of classified restaurants in every one of the county classifications1, from the densest metros to the emptiest rural counties. The prevalence of American food varies the most, running from 17 percent of restaurants in large metro counties to 51 percent in rural ones, with Chinese and Italian as the other two mainstays.
More rare cuisines, like Indian, Korean, and Vietnamese, are still present in the towns, just far less often. Cities simply offer a more varied sample of food, but there aren’t many types of cuisine that are unique to them. Walk into 30 restaurants in or around a large metro area, and you’ll sample something like 10 different national origins of food; perform the same exercise in a rural area, and you’ll only get to about 7.
So what increases the frequency of certain types of restaurants? One simple explanation is that cuisine follows people: When immigrants from a given country arrive in the US, they bring dining establishments with them. There’s some evidence to support this idea, but the degree to which immigrants bring cuisine with them varies.
For each country or national origin, we can calculate an elasticity2 that measures how much increases in that population are associated with increases in the corresponding type of restaurants (e.g. more Russian immigrants = more Russian restaurants). Some types of restaurants are very elastic (Peruvian, Korean) while others are much lower (Puerto Rican, Russian). In general, the long-settled European cuisines are not very elastic: German, Polish and Russian restaurants barely track their ancestry populations at all, perhaps owing to the long-term saturation of those populations in the US. Other, smaller groups seem to concentrate restaurants around them more vigorously. On balance, for most national origins, there is a strong relationship between increases in people and increases in restaurants, about two years later.
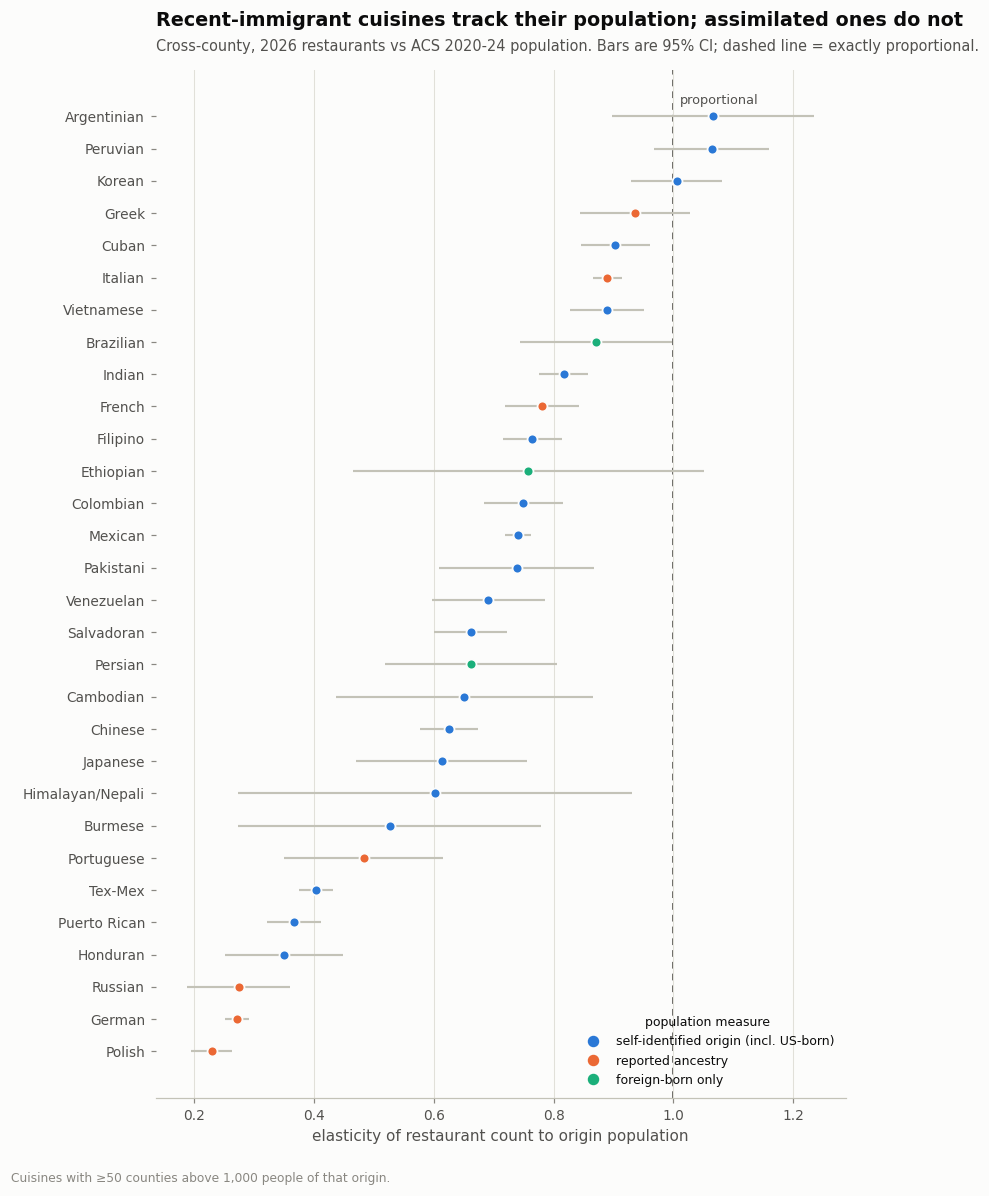
But there’s also very clearly an additional element to the question of culinary dominance, because some types of restaurants are vastly more common than you would expect based on the size of their corresponding communities. Thai restaurants are the leading example: there is about one Thai restaurant for every 13 people of Thai descent in the United States, per Foursquare’s data. Thai restaurants don't cluster especially strongly where Thai immigrants live; instead, they are more popular than expected everywhere, probably because everyone loves Thai food.
It’s important to acknowledge here that correlation is also not causation. The fact that Peruvian restaurants rise in rough proportion (two years later) to the number of Peruvians in a place doesn’t mean that the same Peruvians who arrived opened restaurants. It could be that Peruvian immigrants spurred local business owners to open new eateries to serve the newfound demand, or that places that Peruvians wanted to move to were already incipient clusters of Peruvian culture that produced new restaurants shortly thereafter.
Regardless, the more people from a given country move to some place, the more restaurants from that country there will be. And that’s really what Gutierrez was warning about: when the host of the TV program he was on asked him to elaborate about his terrifying taco prognostication, he responded:
“We are a culture that – we have a lot of good things that we bring to the United States, but we also have problems.”
The tacos themselves, you see, are not the issue (how could they be; they’re scrumptious). Gutierrez, himself a Mexican-born immigrant to the United States, appeared to be warning us all that the people are the problem. In hindsight, his dog whistle screech of a complaint looks positively quaint in comparison to the overt racism of contemporary politics. But he wasn’t wrong that the rise of culinary diversity in the US is a living testament to the increase in its peoples’ diversity, at least in the major metropolitan areas in which that diversity thrives. Ten years on, Gutierrez might be horrified, but Americans are eating well.
1 These county classifications are USDA Rural Urban Continuum Codes (RUCC).
2 For the more technically inclined, the elasticity is actually the slope of the line of best fit between log(population) and log(restaurant proportion) for each pair of (national origin, cuisine) combinations at the county level.