How Many Stories Are There?


Kurt Vonnegut, award-winning author of Slaughterhouse Five and Cat’s Cradle, never considered his books his finest accomplishment. From 1945 to 1947, while studying at the University of Chicago, he wrote a master’s thesis, which he described as “too simple and too fun” and also “his prettiest addition to culture.” In that thesis, Vonnegut described a simple categorization of stories into one of six groups which he said encompassed almost all plots. Those simple groups corresponded to lines that could be written on a graph showing the fortunes of the main character over the course of the story, with labels like “rags to riches” (the protagonist’s fortune steadily improves) and “Icarus” (an improvement, then a rapid decline). The faculty rejected Vonnegut’s thesis unanimously1.
Nevertheless, the idea unquestionably has a lot of appeal–and it turns out, some empirical support. In 2016, Andrew Reagan published an important paper on a dataset of 1300 books, finding evidence for the Vonnegut categorization of plots. I wanted to test Vonnegut’s story shapes myself, but with a different method and a much larger dataset spanning both books and movies. This combined dataset offers several advantages: many more plots (more than 54,000 works of fiction) spanning a long timeframe (the early 1900s to present) and two forms of media with an overlap (books adapted to movies), spread all across the world2.
To get the shape of each plot, I used large language models to standardize the description of each work and then grade the sentiment of events, from the protagonist’s perspective, at eight equally-spaced “beats” throughout the story3. Say I was applying this to Alice in Wonderland: she starts off on a pleasant afternoon (let's say +1), follows the Rabbit to Wonderland (+1), gets in progressively more trouble (0, -1), culminating in the trial (-2) and potential beheading at the Queen of Hearts' court (-3), and finally escapes (+1) back to the real world with more confidence (+2). These numeric judgments are inescapably subjective: the protagonist might lose his job, but learn an important lesson–does that count as a positive or a negative event? As Vonnegut says in the above video, "All we do is pretend to know what the good news is and the bad news is." Acknowledging that there’s no one objective judgment of the main character’s happiness or when the main beats in a story happen, I averaged three separate estimates of a plot to get the final story chart for each work of fiction.
There are two ways to look at this data. One is to impose the Vonnegut structure on the data, assuming that his thesis was right. Another is to let the data tell us what shapes to use4 by grouping the actual curves into similar bunches. If we do the latter, it turns out that although the Vonnegut shapes can be useful, there is one main type of plot that predominates across both movies and books: what Vonnegut would call “man in a hole,” but I will dub “the crisis” (to avoid some awkward phrasing).
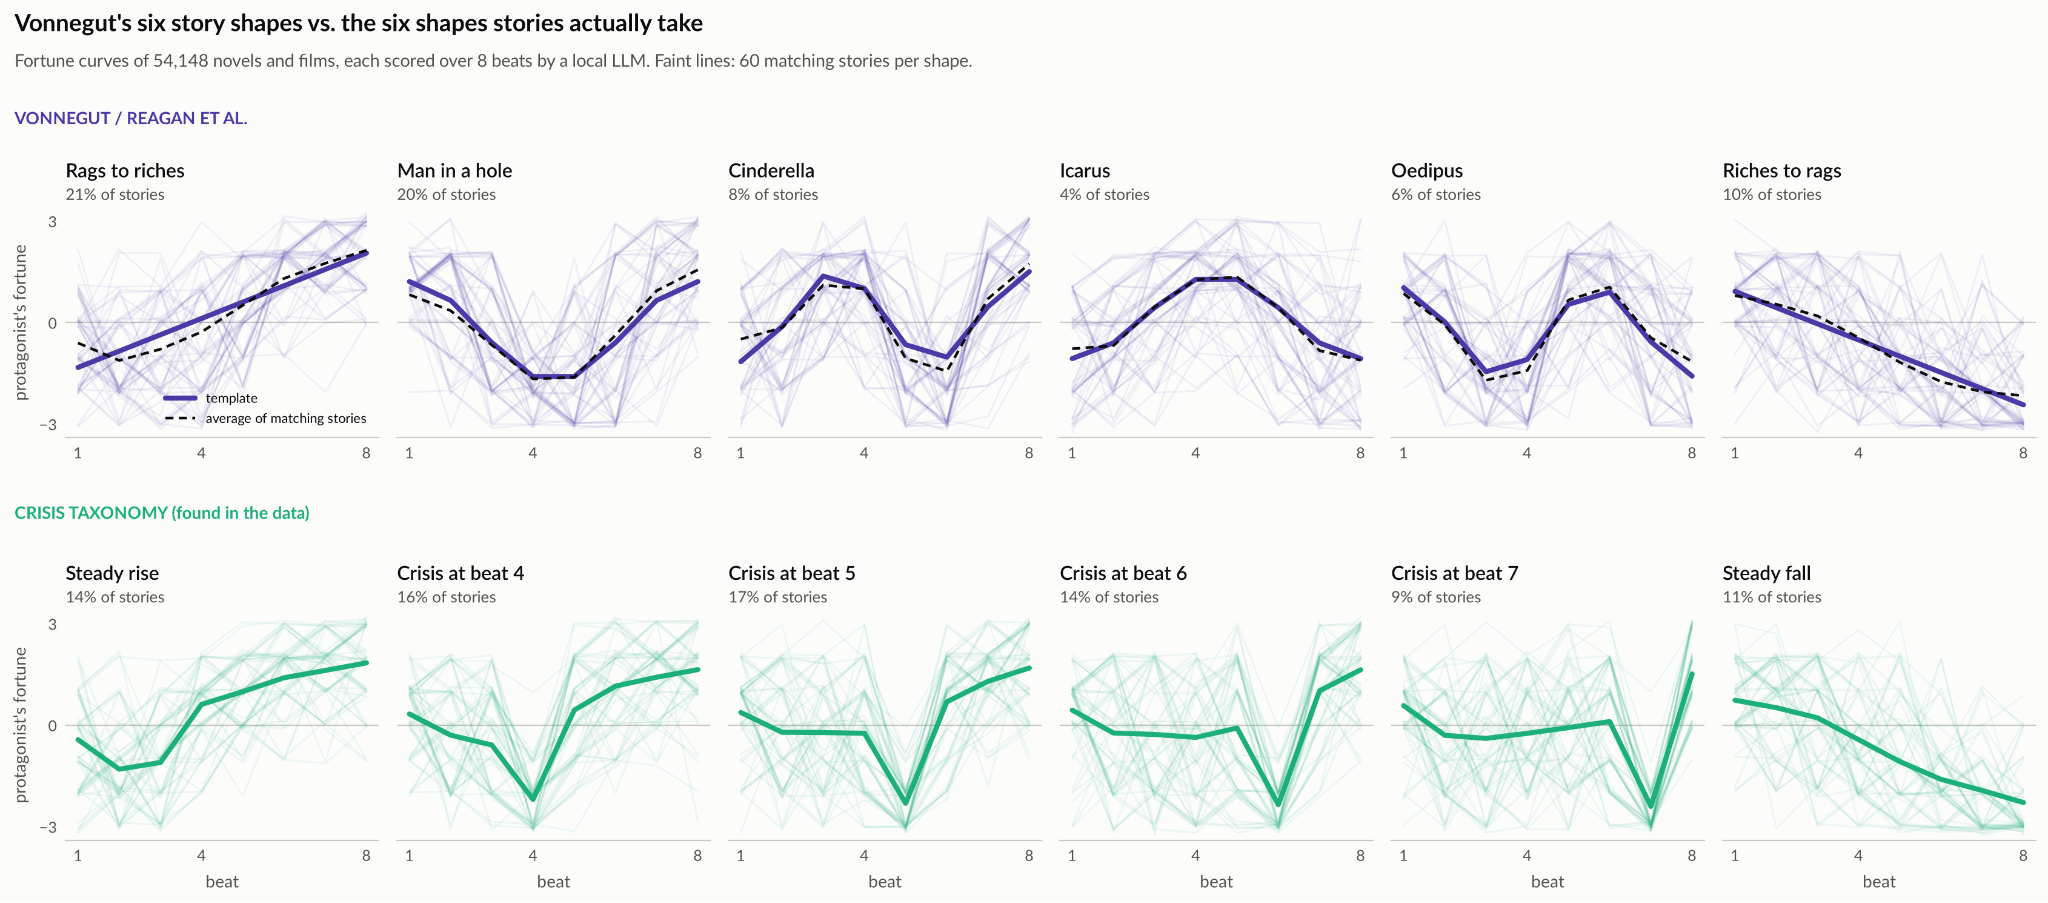
The crisis plot is simple. As represented in one of Vonnegut’s line charts, it looks like an initial decline, some ups and downs, then a drastic catastrophe, followed by a rapid recovery somewhere in the latter half of the story’s events. Alice in Wonderland and most plots (56 percent) in the real data follow this template. Two other Vonnegut shapes make appearances, rags to riches and riches to rags, but some of Vonnegut’s canonical plots, like Oedipus and Icarus, are quite uncommon in the real data (perhaps they were big in Ancient Greece, though). Instead, we see largely various different inflection point timings for the crisis: halfway through the plot, two thirds of the way, near the end like Alice's trial, and so on. Testing the crisis taxonomy versus Vonnegut's six arcs shows that the crises fit much better to the real data, encompassing about 80 percent of the stories in the dataset, instead of about 68 percent with Vonnegut's scheme.
In hindsight, it shouldn’t be surprising that crisis is the dominant plot. Google any screenwriting guide online and you’ll see that most advice is geared towards different ways of writing this same shape. Sure, there are variations–three act structures, Fichtean curves, Hero’s Journeys–but they all basically amount to the protagonist starting happy, getting unhappy, and then triumphing at the end, the very same upside-down pyramid as Vonnegut’s chart.
It’s more than just writers who love this plot: audiences do, too. We have a number of different indicators to use here: for movies, we have user ratings, box office, budget, and Oscars. For books the options are more limited, as I’m not aware of a source for sales data, but we do have various awards and prizes, as well as whether a book was adapted into a movie–which happens primarily to more popular books.
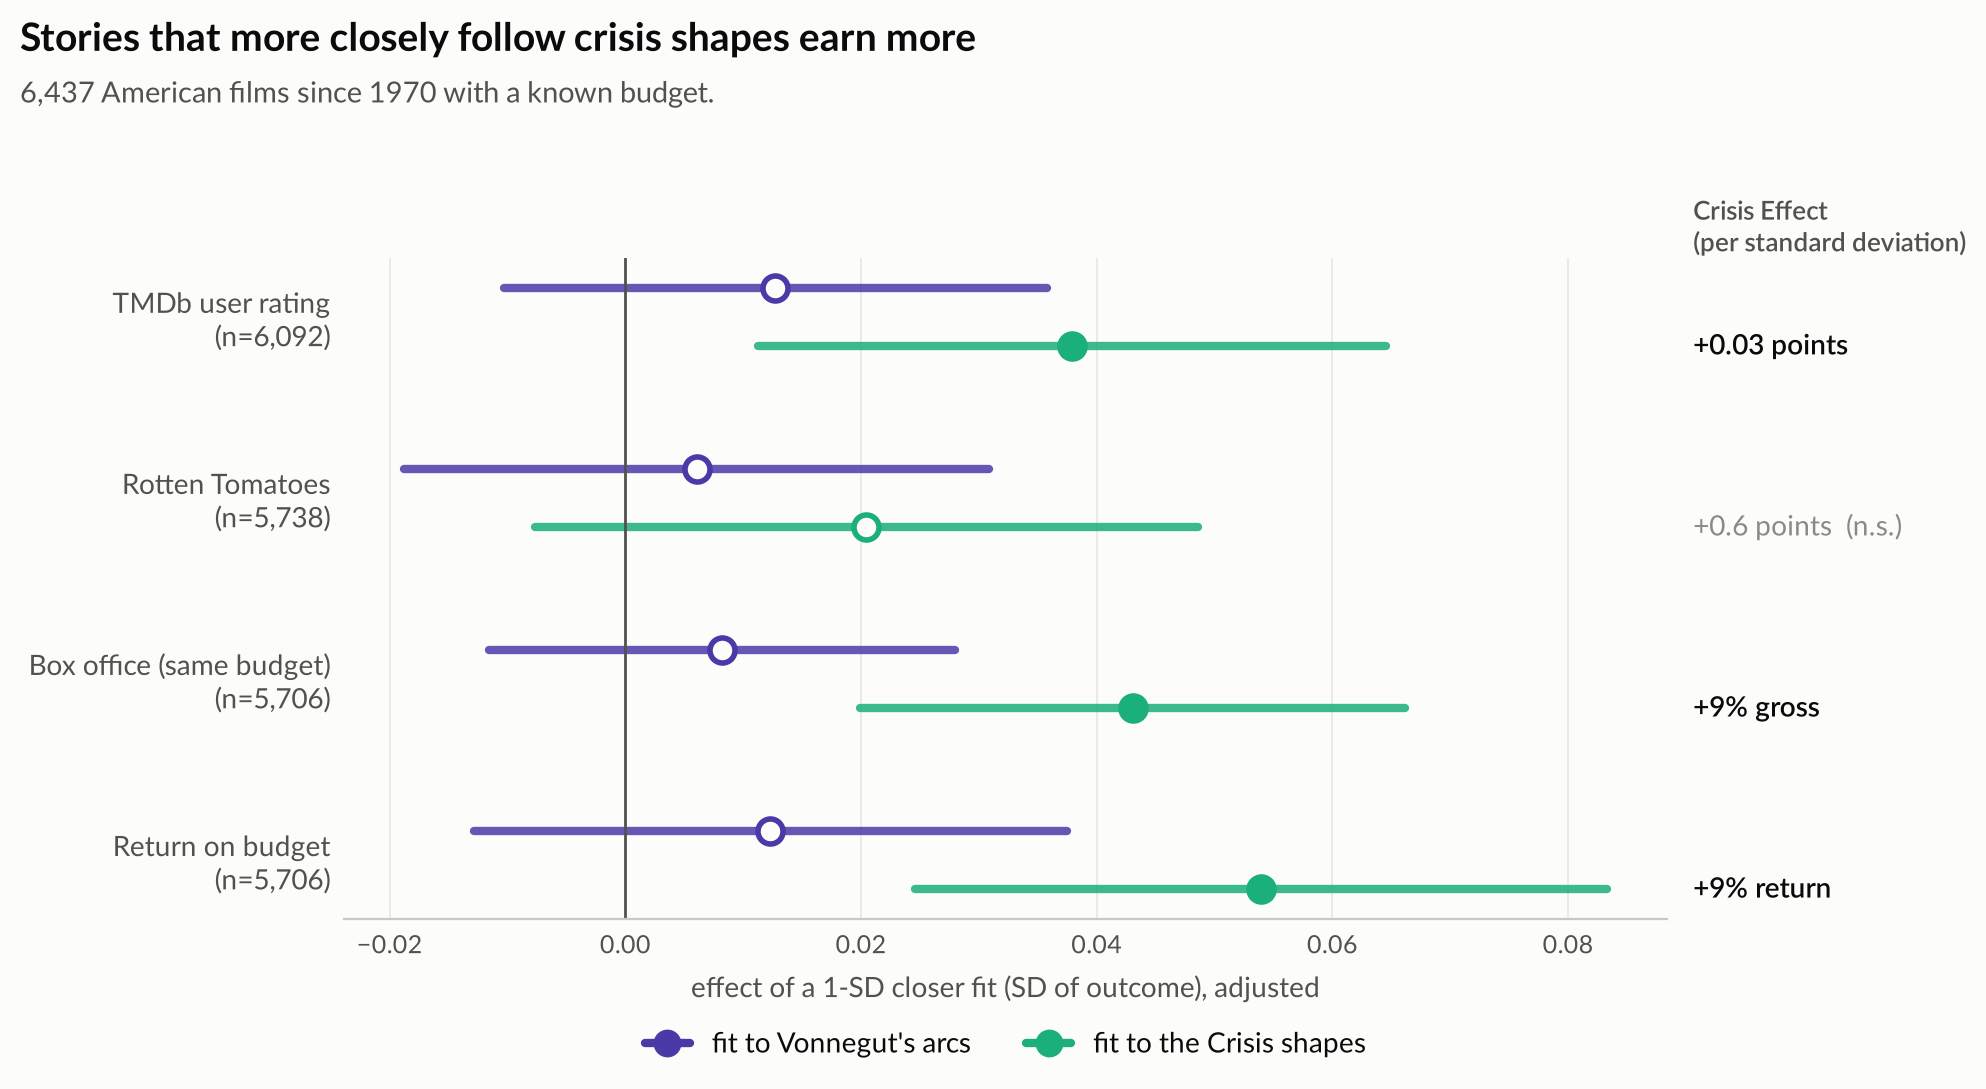
Most of the popularity signals align on one truth: audiences love crisis plots, and the more a given book or movie aligns with that archetype, the higher it will score, the more money it will make, the more likely a given book is to be adapted into a movie. The impact is not small, especially in monetary terms: bringing a plot a bit closer to the crisis archetype can increase a movie's box office tally and return on investment by about 10 percent. Small tweaks to a script to make it more crisis-like can amount to millions of extra dollars made.
Critics’ (and award panel members’) tastes are apparently more sophisticated: they don’t tend to reward any particular plot structure especially, not even the crisis. This goes equally for books and movies alike. For movies, we have direct critic ratings from sites like Rotten Tomatoes. Both media have awards we can look at as well (Oscars, Booker and Hugo Prizes, etc.). That's not to say that plots don't matter to critics, but rather that they don't seem to have a clear preference for one type of plot over others.
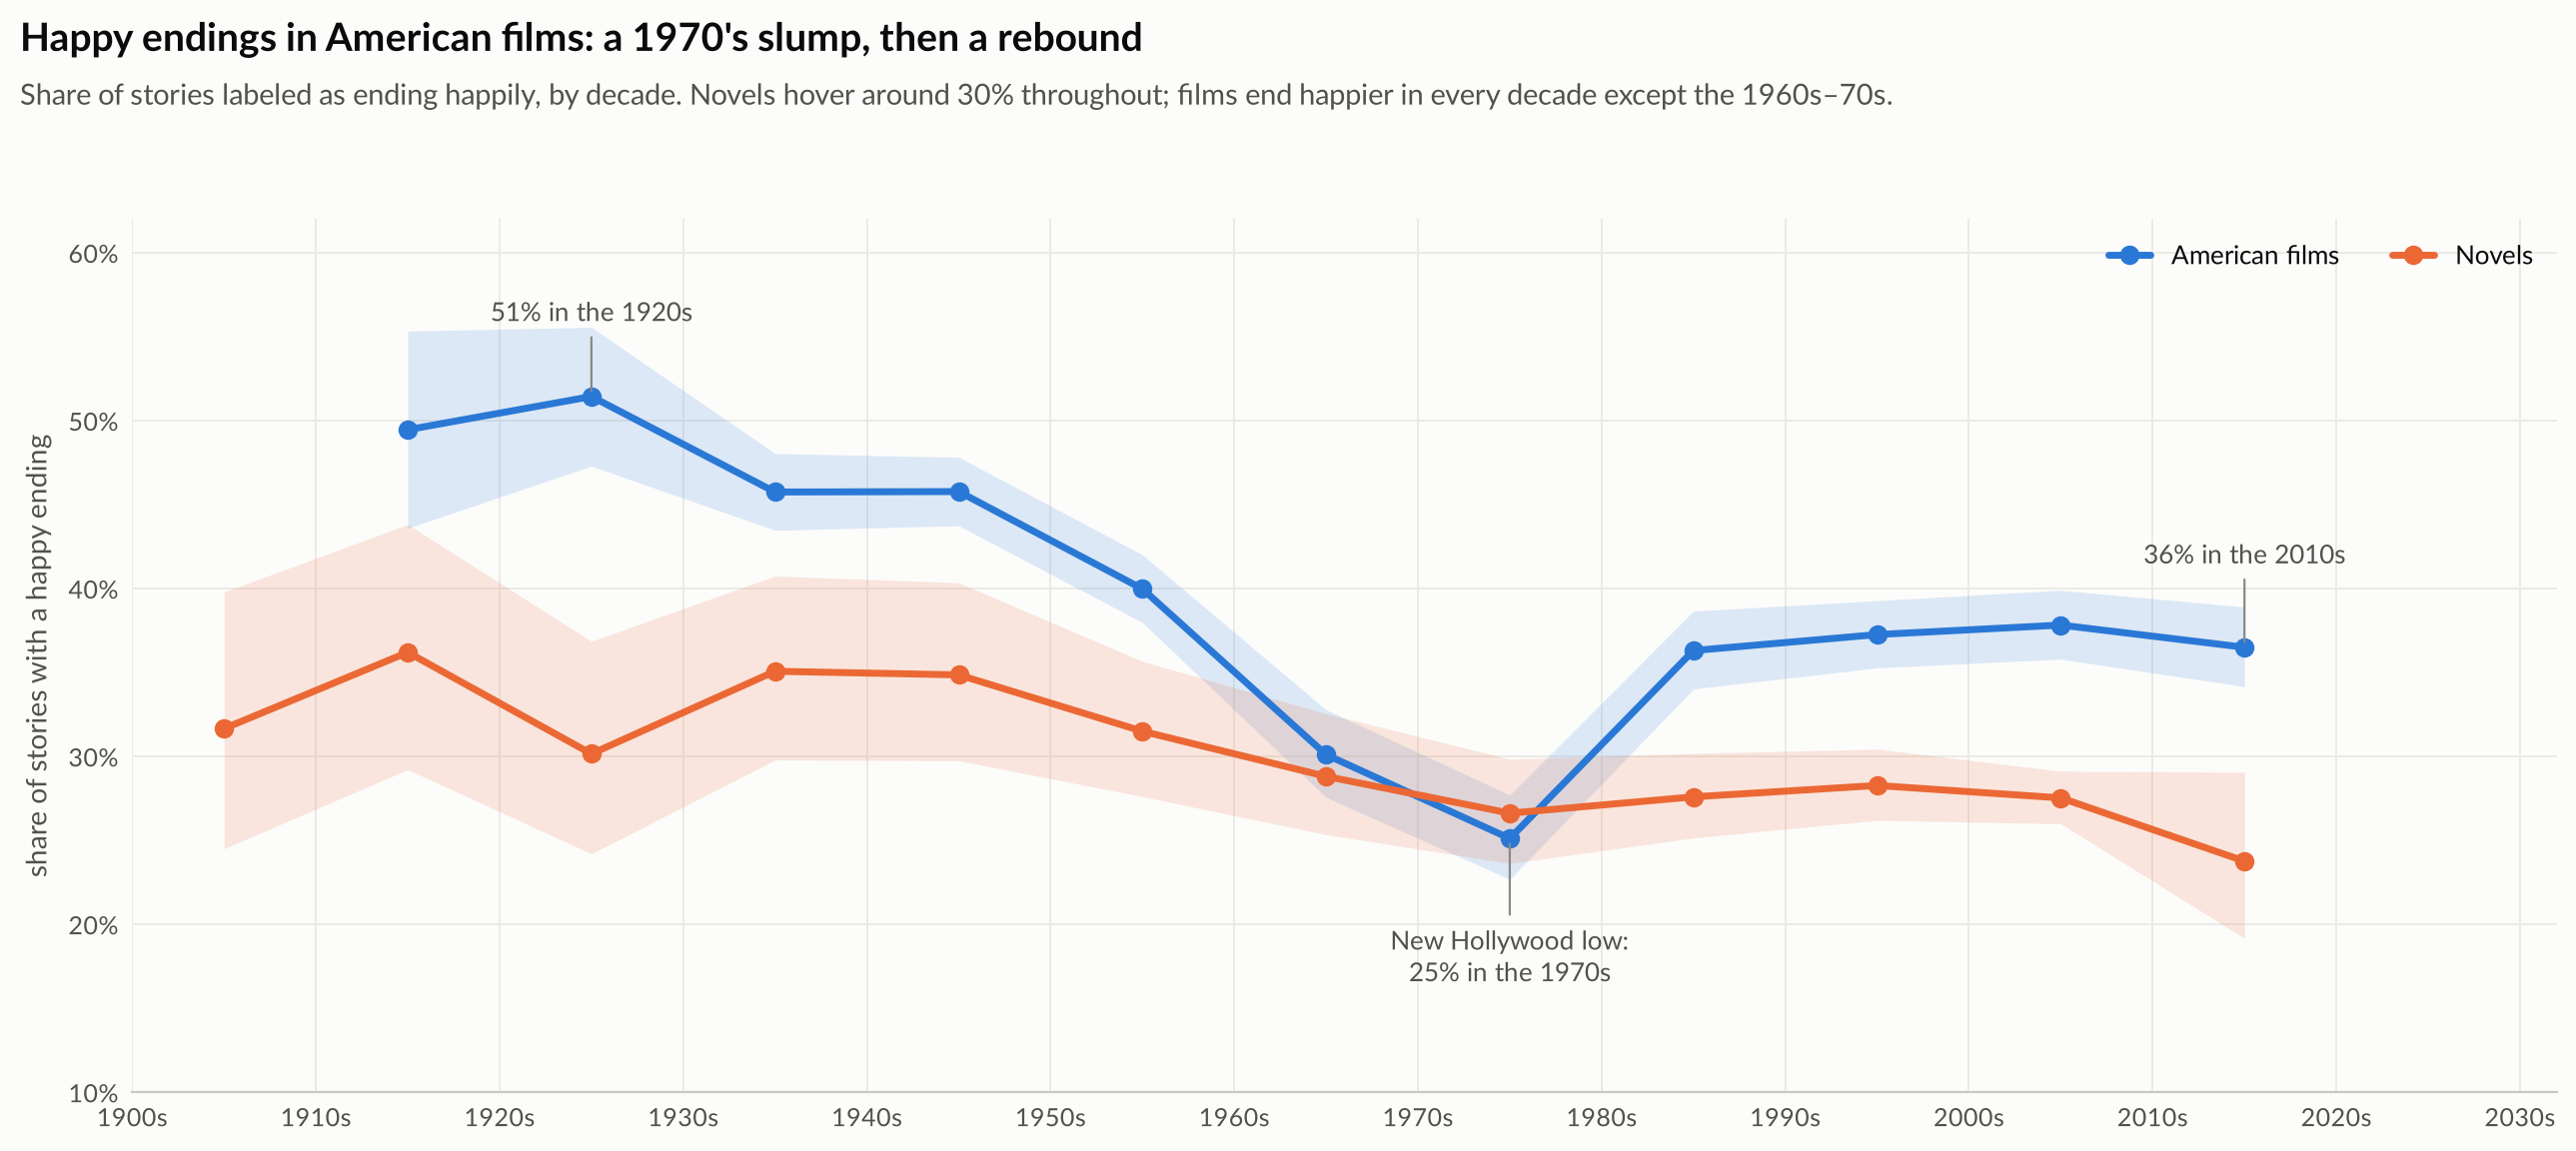
Vonnegut wrote his thesis in the 1940s, in the wake of World War II. It’s fair to say that times have changed a bit since then and so maybe his theory was right for the time, but not so much anymore. But in looking over the data, the same basic plot structures in the 40s are present now. For the most part, movies have tended to show an identical preference for the crisis for all this time, with a notable detour into more sad plots in the 60s and 70s.
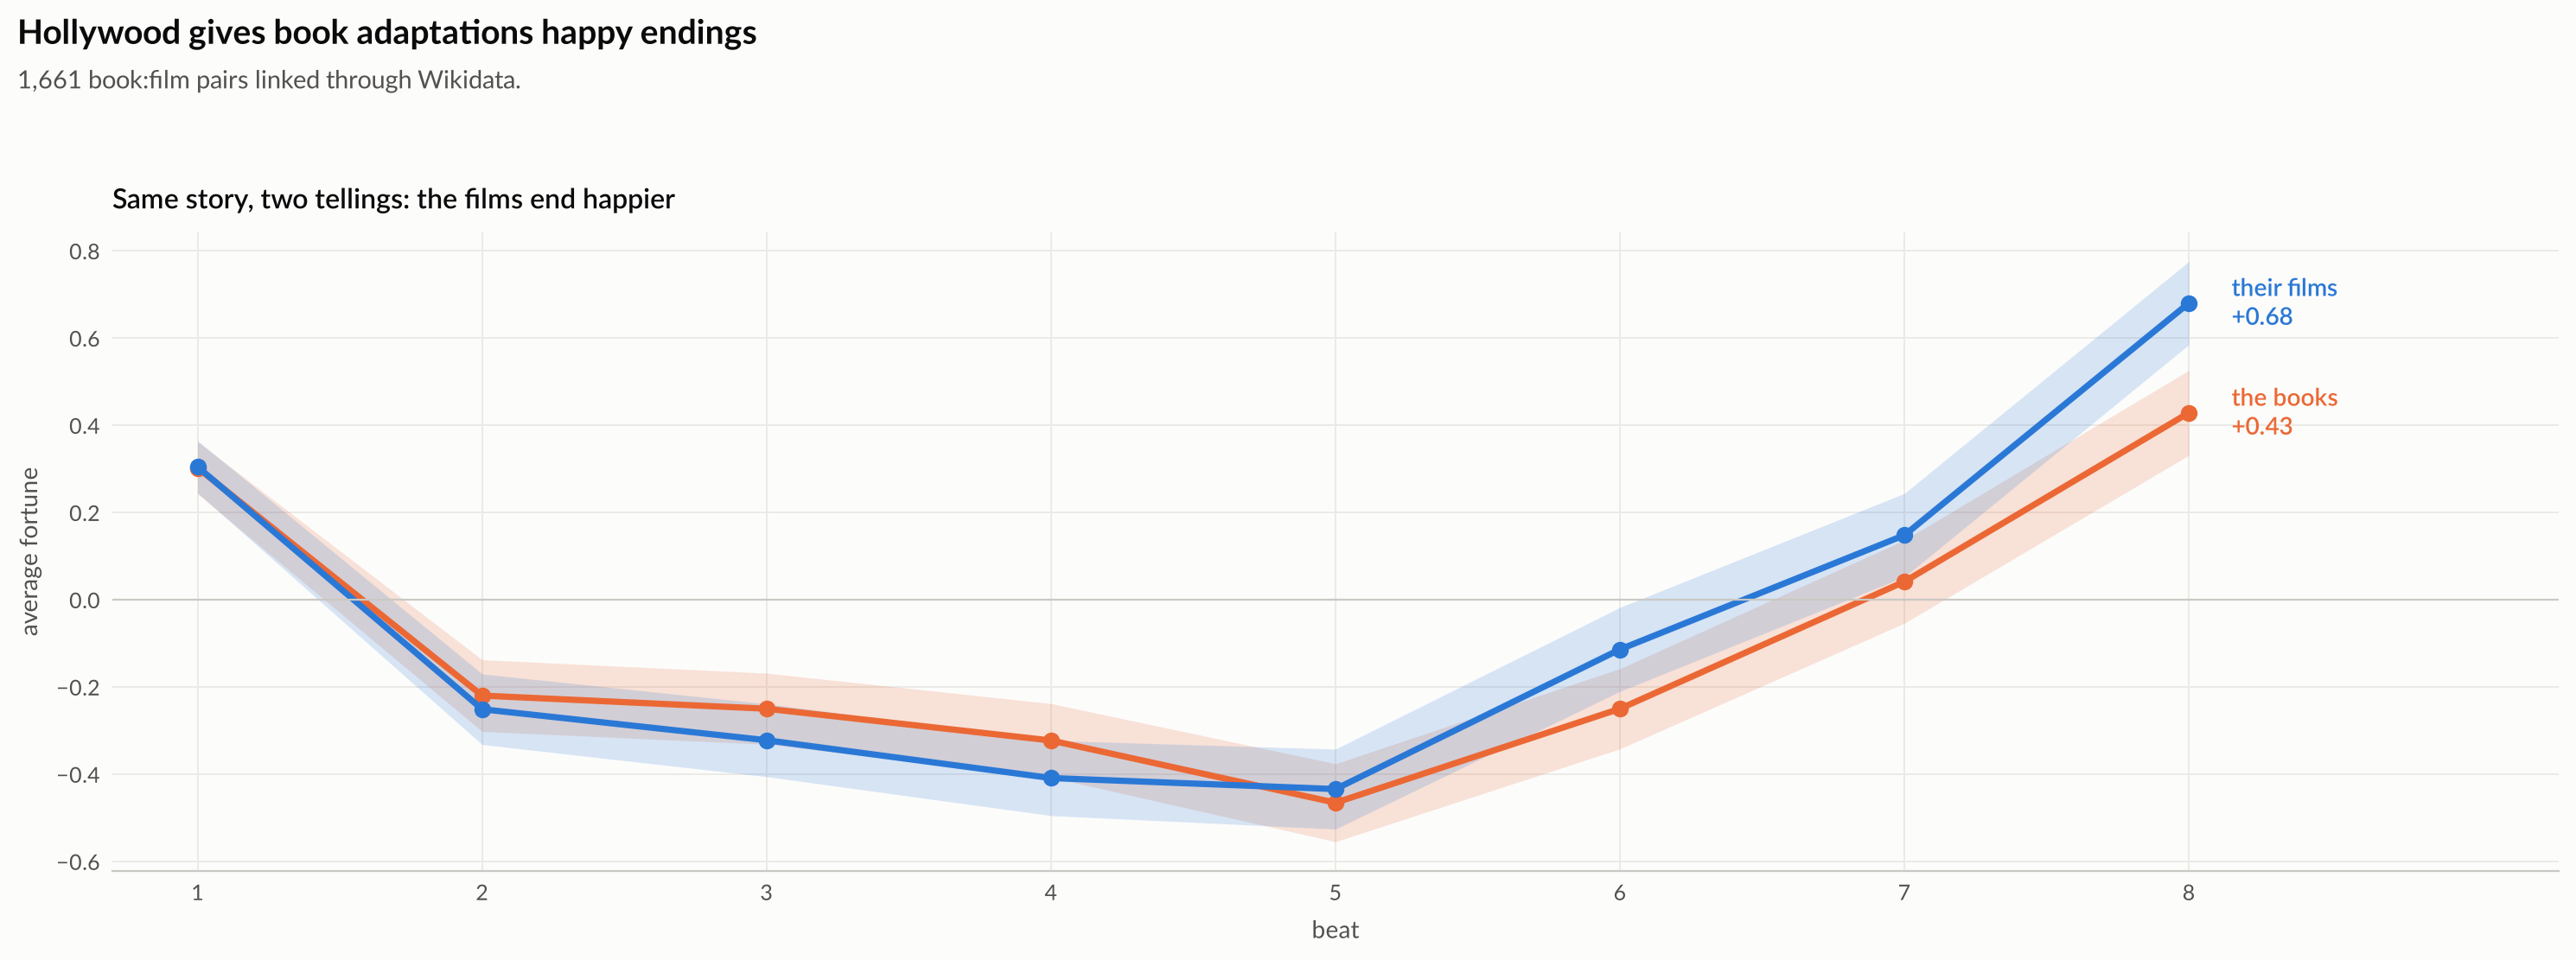
One interesting side note emerges from that same analysis. Books that are adapted into movies usually feature cheerier endings in their cinematic forms. The Hollywood Ending is a real pattern borne out in the data. You can also see just how dominant the crisis plot is: it's the default shape for these adaptations.
Obviously, none of this analysis proves Mr. Vonnegut wrong. It's just an effort to, in his own words, "bring some scientific thinking to literary criticism." He could respond that all of the crisis plots are mere variations on the same basic shape, and he’d be right. But that shape does stick out; it’s not just another one of Vonnegut’s lines on a chart. It’s the plot that motivates movie execs to adapt books, the plot that puts butts in theater seats, and the plot that makes money. While critics may love the full spectrum of story shapes, audiences have eyes only for the man in the hole.
1 The anthropology faculty later awarded him his degree, but not because of the “story shape” thesis; they accepted his novel Cat’s Cradle as his thesis instead.
2 I grabbed movie plot summaries from Wikidata, cross-referenced with the Movie Database. For books, I used a pre-assembled dataset with similar methodology (from Wikipedia) from Carnegie Mellon.
3 You can also grade at six or four or ten points and the qualitative results will be the same.
4 I used Singular Value Decomposition (SVD) to extract these typical story shapes.